


 30 / 236

BALANCE SHEET
Ploughback of business surplus
into the business (Rs. 205
crore as on March 31, 2017)
increased the shareholders’
funds even as the Company’s
equity remain unchanged at
Rs. 15.89 crore. Consequently,
the book value per share
increased from Rs. 121.98
as on March 31, 2016 to Rs.
147.91 as on March 31, 2017.
The Company’s external debt
portfolio declined from Rs.
293.66 crore as on March
31, 2016 to Rs. 213.16 crore
as on March 31, 2017. The
Company’s debt-equity ratio
declined from 0.28x as on
March 31, 2016 to 0.17x as
on March 31, 2017.
The Company’s Net Block
increased marginally from Rs.
1,120.51 crore as on March
31, 2016 to Rs. 1,177.29 crore
as on March 31, 2017 as there
was not much new capacity
addition during the year under
review except conversion of
ceramic tile unit into glazed
vitrified at Sikandrabad.
The Company plans to add
fresh capacity in the current
year which should add to its
Gross Block and increase the
provision for depreciation post
commissioning.
The Working Capital cycle
stood at 46 days in 2016-17
as against 44 days in 2015-16.
This increase was largely due
to a increase in receivables
due to competitive pressure
and a challenging market
environment.
The Company maintains a
system of well-established
policies and procedures for
internal control of operations
and activities. The team
continuously strive to integrate
the entire organisation from
strategic support functions
like finance, human resources,
and regulatory affairs to core
operations like research,
manufacturing and supply
chain. The internal audit
function is further strengthened
in consultation with statutory
auditors for monitoring
statutory and operational issues.
The Company has appointed
Ernst & Young LLP, Chartered
Accountants, as internal
auditors. The prime objective of
this audit is to test the adequacy
and effectiveness of all internal
control systems and suggest
improvements. Significant issues
are brought to the attention
of the audit committee for
periodical review.
The enterprise-wide risk
evaluation and validation
process is carried out regularly
by the Risk Management
Committee and the Board of
Directors.
Note: The figures for financial years 2015-2016 and 2016-17 are in accordance with Ind-AS and figures for other financial years
are as per Indian GAAP prevailing at that time.
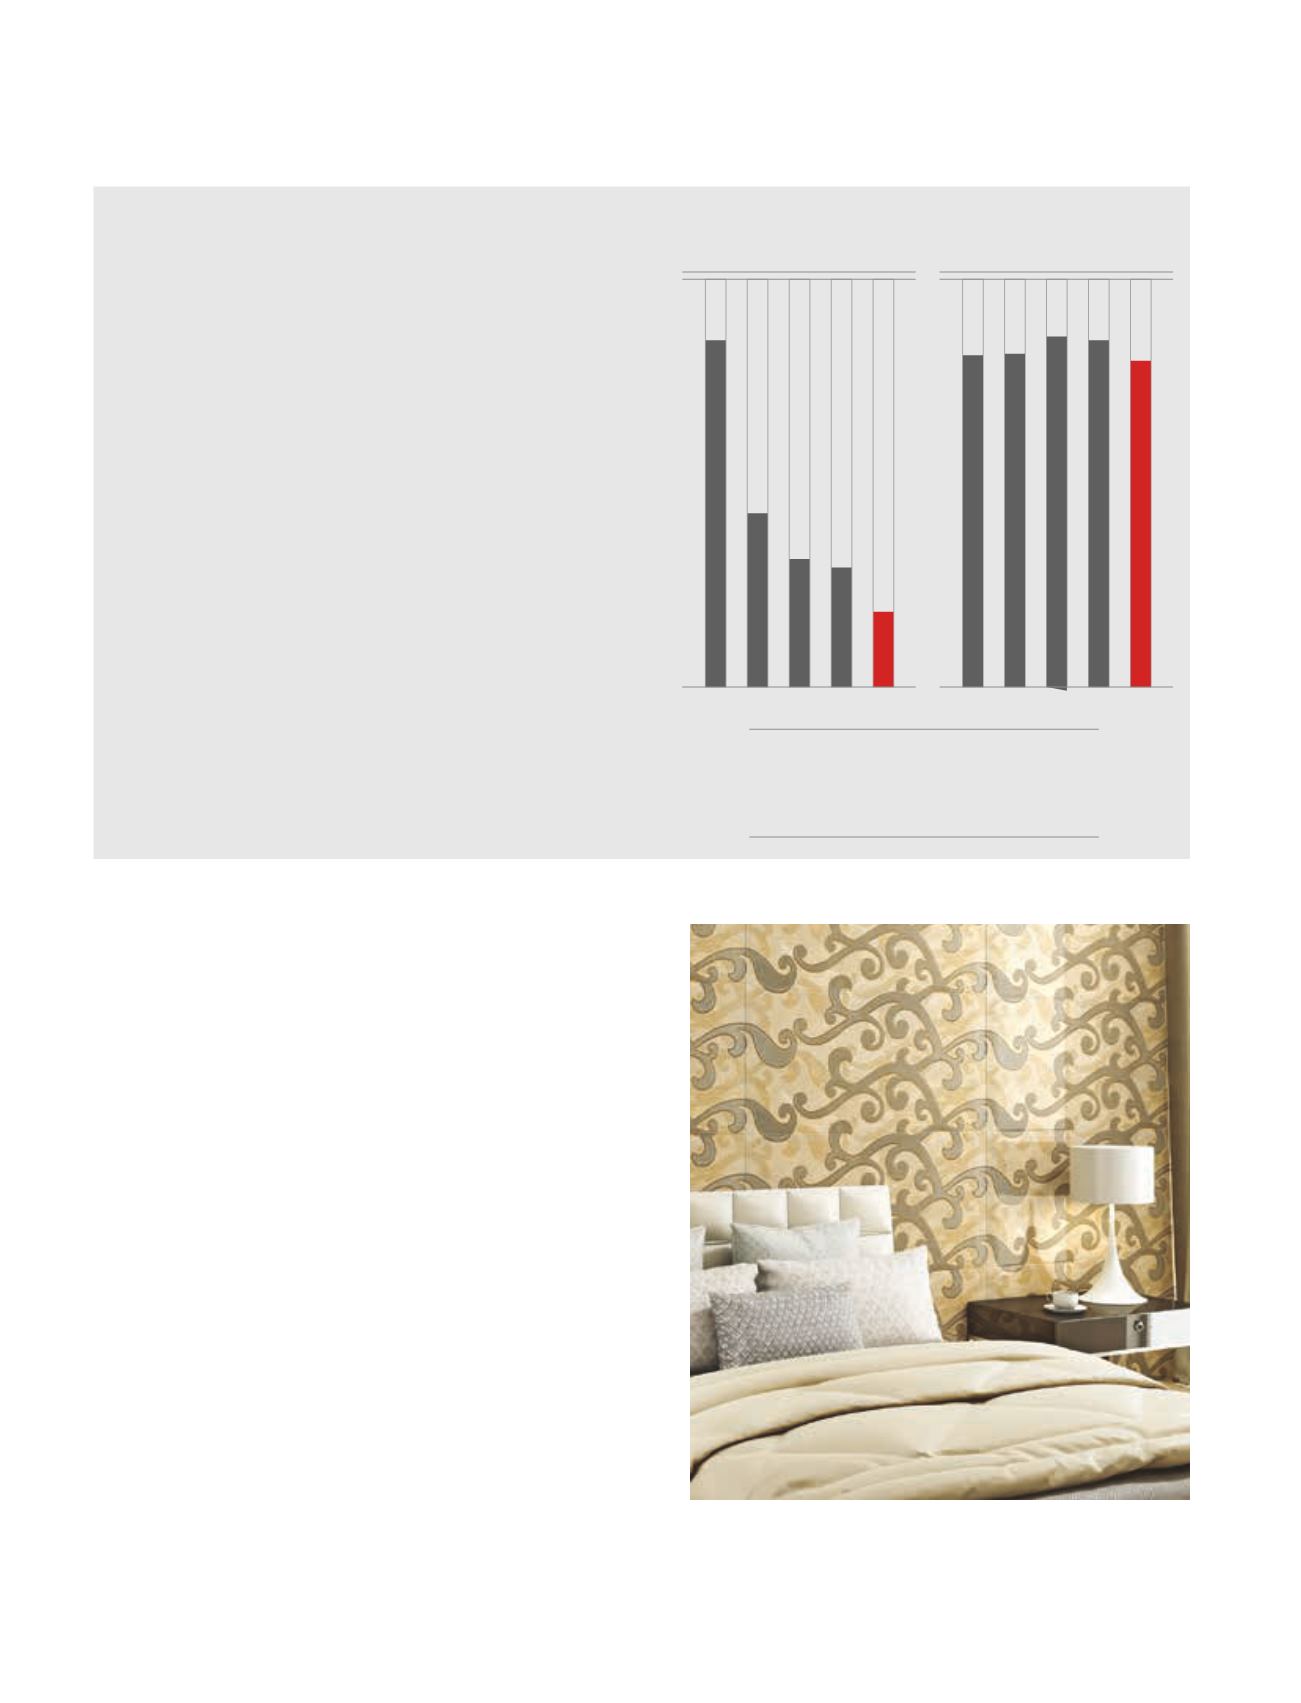
CASH AND BANK BALANCE
RS. 51 CRORE AS ON MARCH
31, 2017
2012-13
2013-14
2014-15
2015-16
2016-17
0.82
0.41
0.30
0.28
0.17
Debt-equity
(x)
2012-13
2013-14
2014-15
2015-16
2016-17
28.89
29.06
30.49
30.08
28.39
Return on capital
employed
(%)
INTERNAL CONTROL SYSTEMS
AND THEIR ADEQUACY
028