


 218 / 236

216
Notes on the consolidated financial statements
for the year ended 31 March 2017
(
`
in crores)
31 March 2017
31 March 2016
Number
WAEP
Number
WAEP
Oustanding at 1 April
229,000
425*
-
-
Granted during the year
-
229,000
850
Share spilt during the year (refer note '13C')
229,000
425
-
-
Forfeited during the year
(40,000)
425
-
-
Exercised during the year
-
-
-
-
Expired during the year
-
-
-
-
Outstanding at 31 March
418,000
229,000
Exercisable at 31 March
0
0
39. Share Based Payments
(contd...)
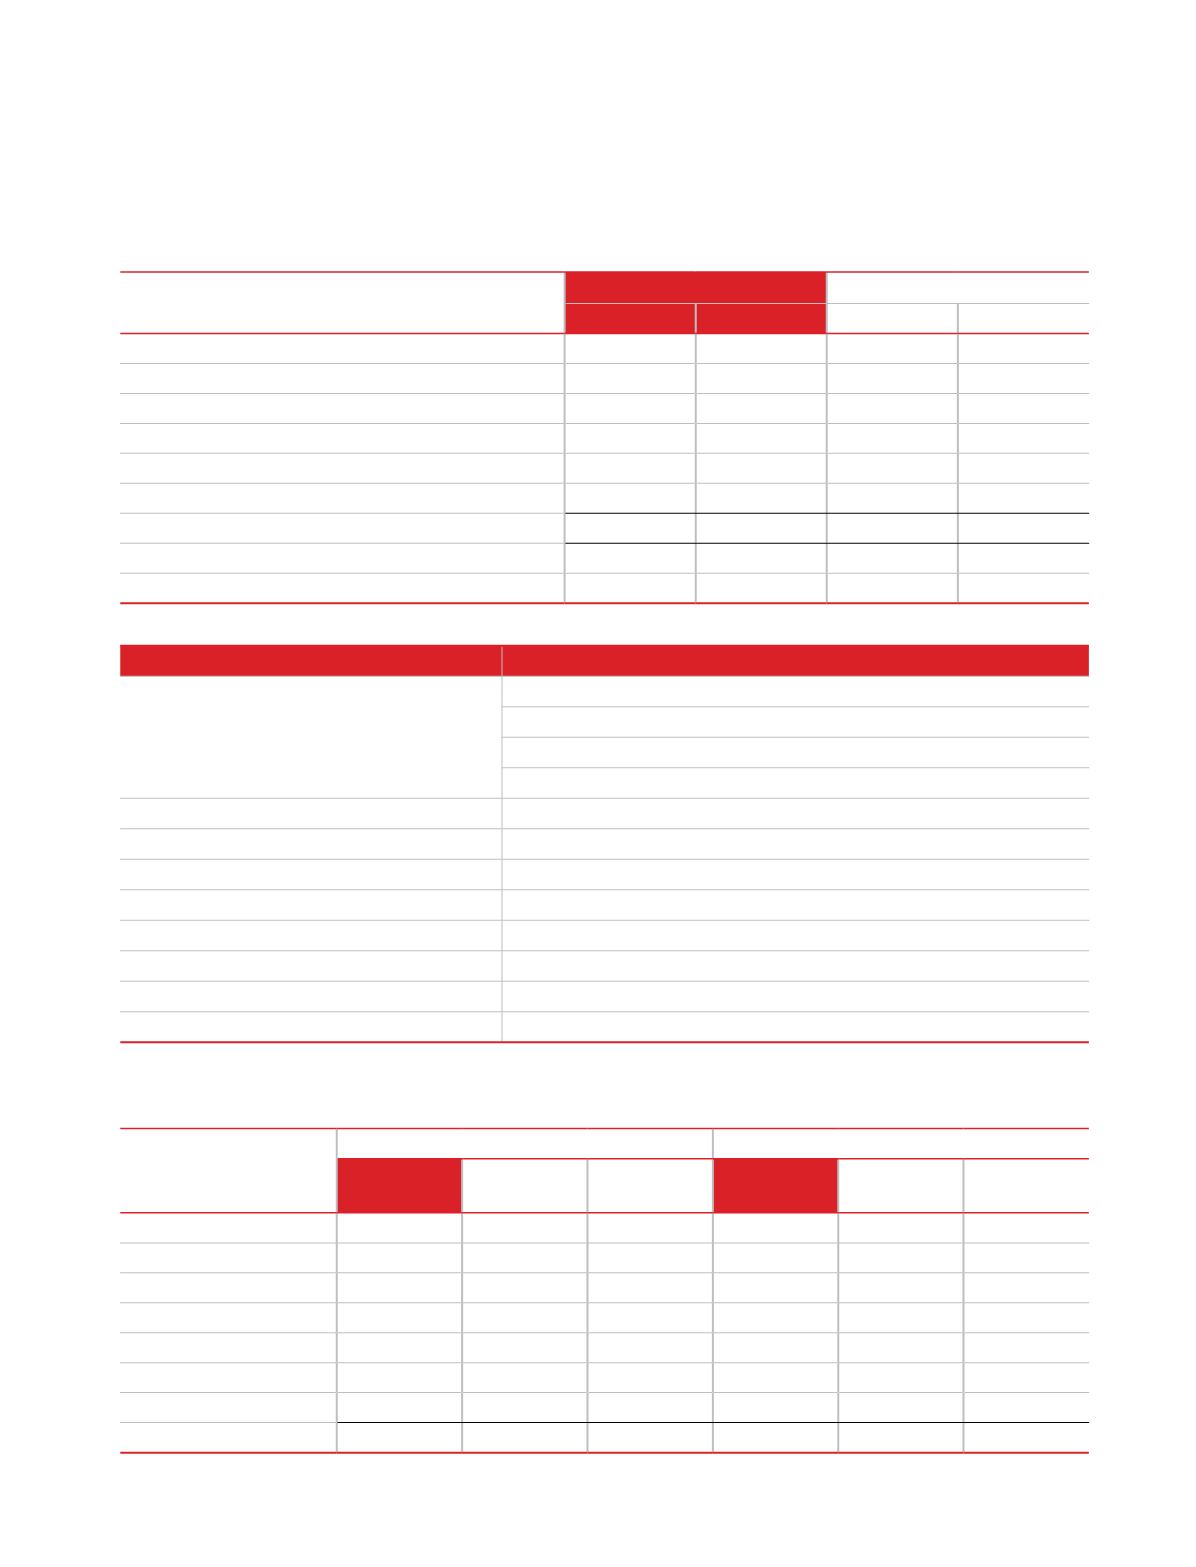
Movements during the year
The following table illustrates the number and weighted average exercise prices (WAEP) of, and movements in, share options
during the year:
Particulars of Scheme
Name of scheme
Employee Stock Option Plan 2015
Vesting conditions
45,800 options 24 months after the grant date (‘First vesting’)
91,600 options 36 months after the grant date (‘Second vesting’)
1,37,400 options 48 months after the grant date (‘Third vesting’)
1,83,200 options 60 months after the grant date (‘Fourth vesting’)
Exercise period
Stock options can be exercised within a period of 8 years from grant date.
Number of share options
4,58,000
Exercise Price
`
425
Remaining Life as on 31.03.2017
3.50 years
* Adjusted for share split post approval of the scheme
(
`
in crores)
Carrying value
Fair value
As at
31- Mar- 2017
As at
3-Mar-2016
As at
1-Apr-2015
As at
31- Mar- 2017
As at
3-Mar-2016
As at
1-Apr-2015
Financial assets
Investments
0.01
-
-
0.01
-
-
Loans
21.65
32.03
34.12
21.65
32.03
34.12
Trade receivables
338.92
274.11
215.20
338.92
274.11
215.20
Cash and cash equivalents
49.84
19.75
9.80
49.84
19.75
9.80
Other bank balances
2.12
1.77
1.36
2.12
1.77
1.36
Other financial assets
1.50
1.72
5.44
1.50
1.72
5.44
Total
414.04
329.38
265.92
414.04
329.38
265.92
40. Fair values
Set out below, is a comparison by class of the carrying amounts and fair value of the Company’s financial instruments.