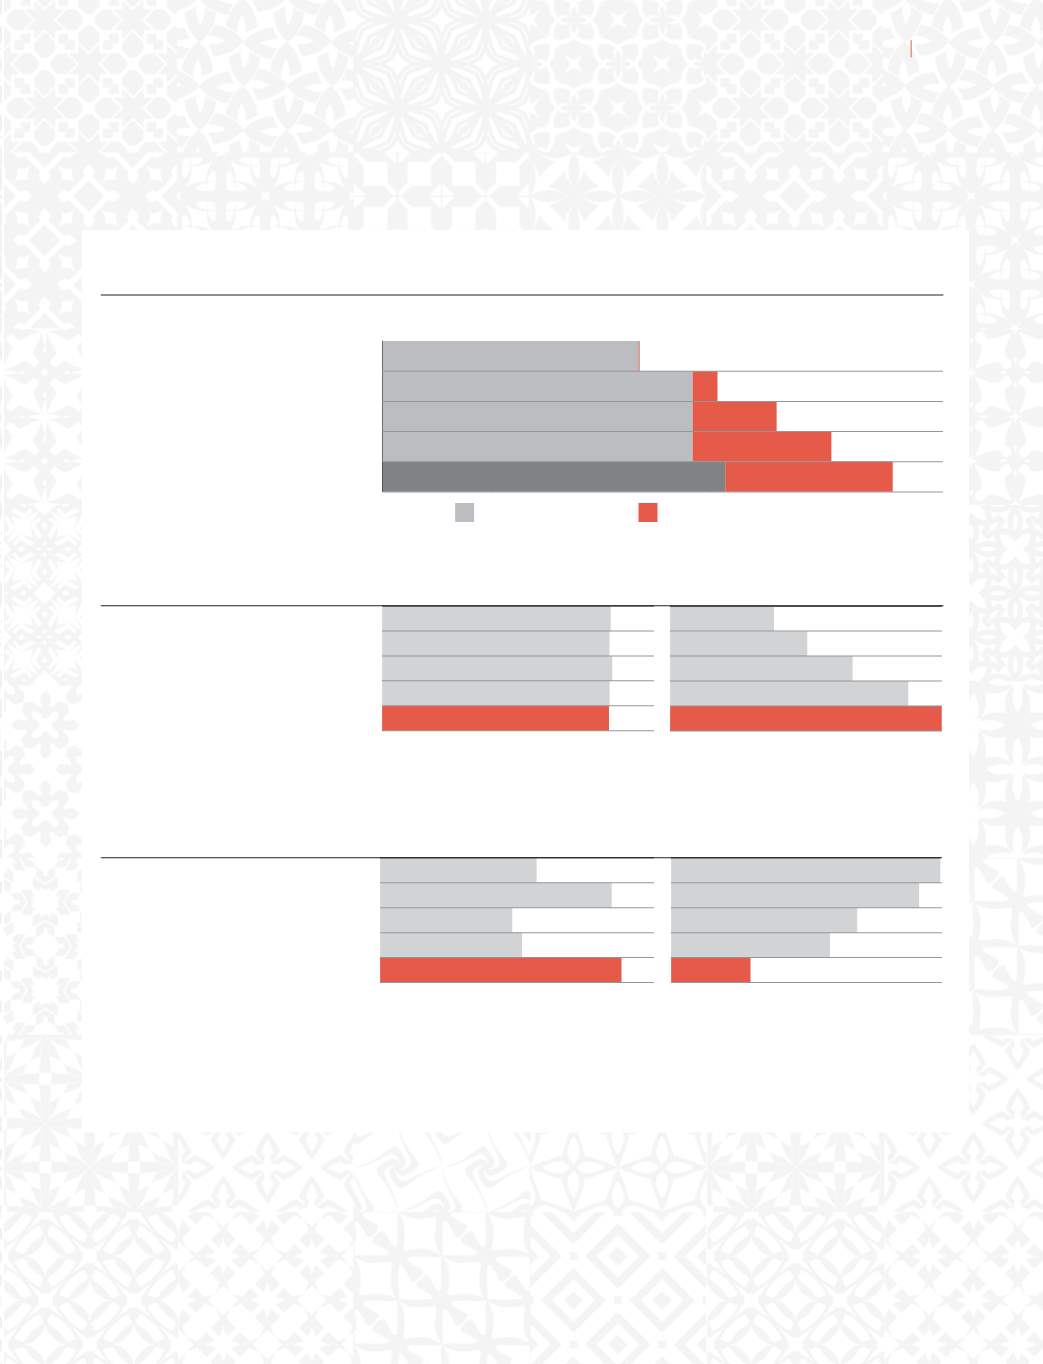
Own capacity (MSM)
JV capacity (MSM)
23.40
28.30
2.30
28.30
7.70
28.30
12.70
31.30
15.30
FY10
FY11
FY12
FY13
FY14
Strengthening
business
FY14
15.61
FY13
15.65
FY12
15.83
FY11
15.64
FY10
15.73
EBIDTA margins (%) – industry beating
Proactive
expansion
FY14
1,661
FY13
976
FY12
909
FY11
1,594
FY10
1,077
Healthy cash flow (
`
million)
FY14
14.03
FY13
12.29
FY12
9.42
FY11
7.08
FY10
5.36
Despite a huge hike in RLNG prices (US$/mmbtu)
FY14 0.41
FY13
0.82
FY12
0.96
FY11
1.28
FY10
1.39
Falling debt-equity (x)
Liquid
Balance Sheet
3
Annual Report 2013-14


