


 79 / 236

Financial Year :
April 1 to March 31
Financial Calendar (Tentative)
First Quarter Results :
2nd week of August 17
Second Quarter/ Half Yearly
Results :
4th week of October 2017
Third Quarter / Nine Months
Results :
4th week of January 2018
Fourth Quarter / Annual Results
for the year ending 31st March
2018 :
2nd week of May, 2018
Dividend Payment date
Dividend shall be paid to all eligible shareholders within 30
days from the date of declaration at the 31st Annual General
Meeting.
Dividend history for the last 5 years is as under:
Year
Dividend
Rate (%)
In per Share (Face
value of Rs. 2/-)
Dividend Amount
(Rupees in Crores)
2011-12 125
Rs. 2.50
18.40
2012-13 150
Rs. 3.00
22.08
2013-14 175
Rs. 3.50
26.45
2014-15 200
Rs. 4.00
31.79
2015-16 250
Rs. 5.00
39.73
Unpaid / Unclaimed Dividend:
All the unpaid / unclaimed dividend up to the financial year
2008-09 have been transferred to Investor Education and
Protection Fund (IEPF). No claims will lie against the Company
or the Fund in respect of unclaimed amount so transferred.
The unclaimed dividend declared in respect of the financial year
2009-10 is due to be transferred to the Investor Education and
Protection Fund.
Listing on Stock Exchanges:
• BSE Limited, Phiroze Jeejeebhoy Towers, Dalal Street,
Mumbai-400001 (‘BSE’).
• National Stock Exchange of India Limited, "Exchange Plaza",
Bandra-Kurla Complex, Bandra (E), Mumbai 400051 (‘NSE’)
Listing fees for the financial year 2017-18 has been paid by
your Company within the stipulated time.
Stock Code :
500233 (BSE) / KAJARIACER (NSE)
ISIN
:
INE217B01036
Market Price Data:
Monthly High and Low quotation of shares traded on BSE
/ NSE during the year 2016-17:
(in Rs.)
Month
BSE
NSE
High Low High Low
April, 2016
1073.50 938
.00 1074.80 936.15May, 2016
1113
.00 1040.00 1085.001035.00
June, 2016
1223.10 1050
.00 1229.70 1070.00July, 2016
1271.15 1187.75 1275.00 1185.00
August, 2016 1289.90 1221
.00 1289.90 1220.05September, 2016 1424.90 1265.05 1427.00 1265.00
October, 2016 1408
.00 583.10 1409.90 582.00
November, 2016* 639
.00 440.90 639.90 440.15
December, 2016* 540
.00 437.30 541.05 437.35
January, 2017* 605.70 469.85 605.25 468.60
February, 2017* 610.65 554
.00 609.80 553.10March, 2017*
599
.00 545.05 594.00 545.55
* Equity shares have been split off from Rs. 2/- each to Re. 1/-
each w.e.f. October 4, 2016.
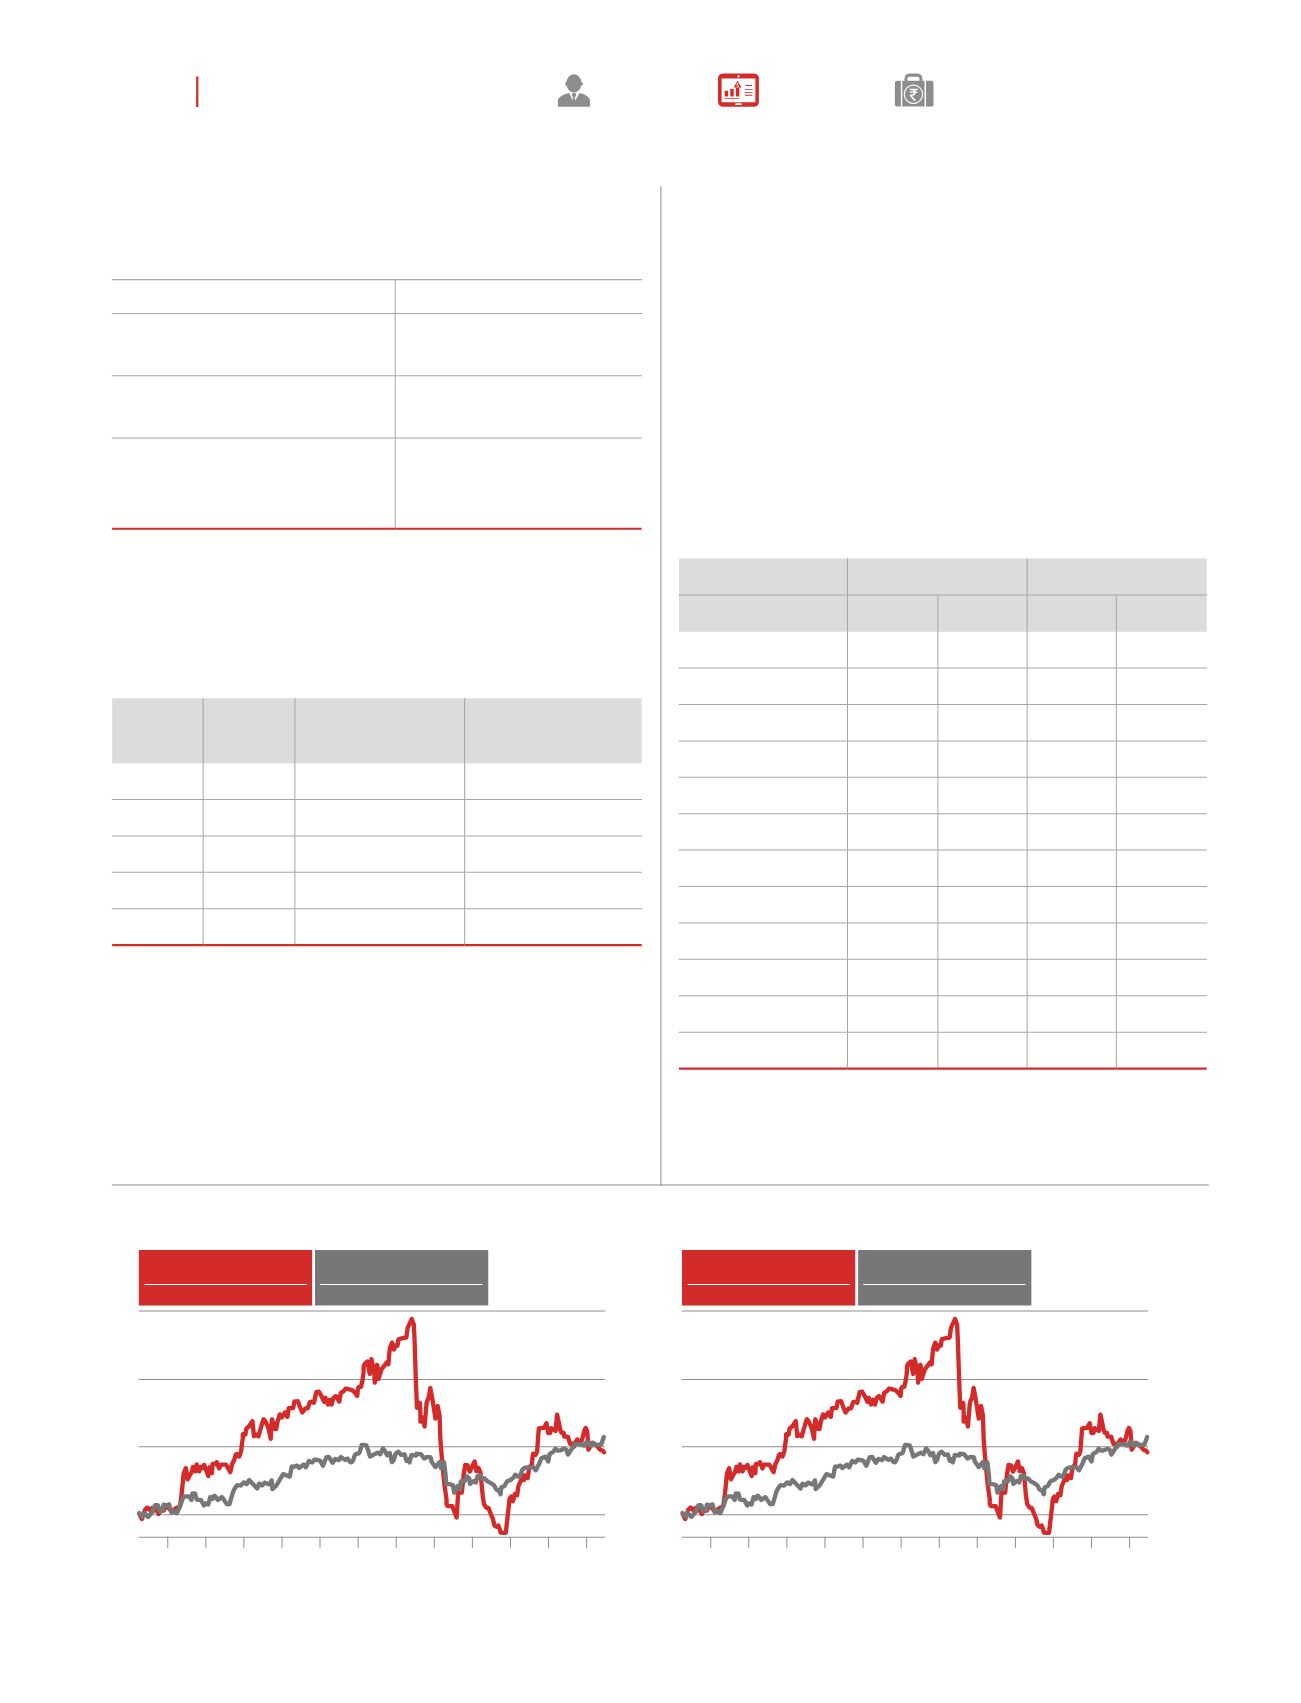
Performance in comparison to Broad Based Indices of BSE & NSE:
Apr 16
May 16
Jun 16
Jul 16
Aug 16
Sep 16
Oct 16
Nov 16
Dec 16
Jan 17
Feb 17
0%
20%
40%
60%
Mar 17
Apr 16
May 16
Jun 16
Jul 16
Aug 16
Sep 16
Oct 16
Nov 16
Dec 16
Jan 17
Feb 17
0%
20%
40%
60%
Mar 17
Kajaria Ceramic
594.50 (27.39%) 8,302.90 (8.92%)
-NSE
-BSE
CNX 100
Kajaria Ceramic
619.85
(32.82%) 9,008.94 (18.08%)
-NSE
-BSE
S&P BSE 100
077
ANNUAL
REPORT
20
16-17
KAJARIA
CERAMICS
CORPORATE
OVERVIEW
MANAGEMENT
REPORTS
FINANCIAL
STATEMENTS