


 59 / 236

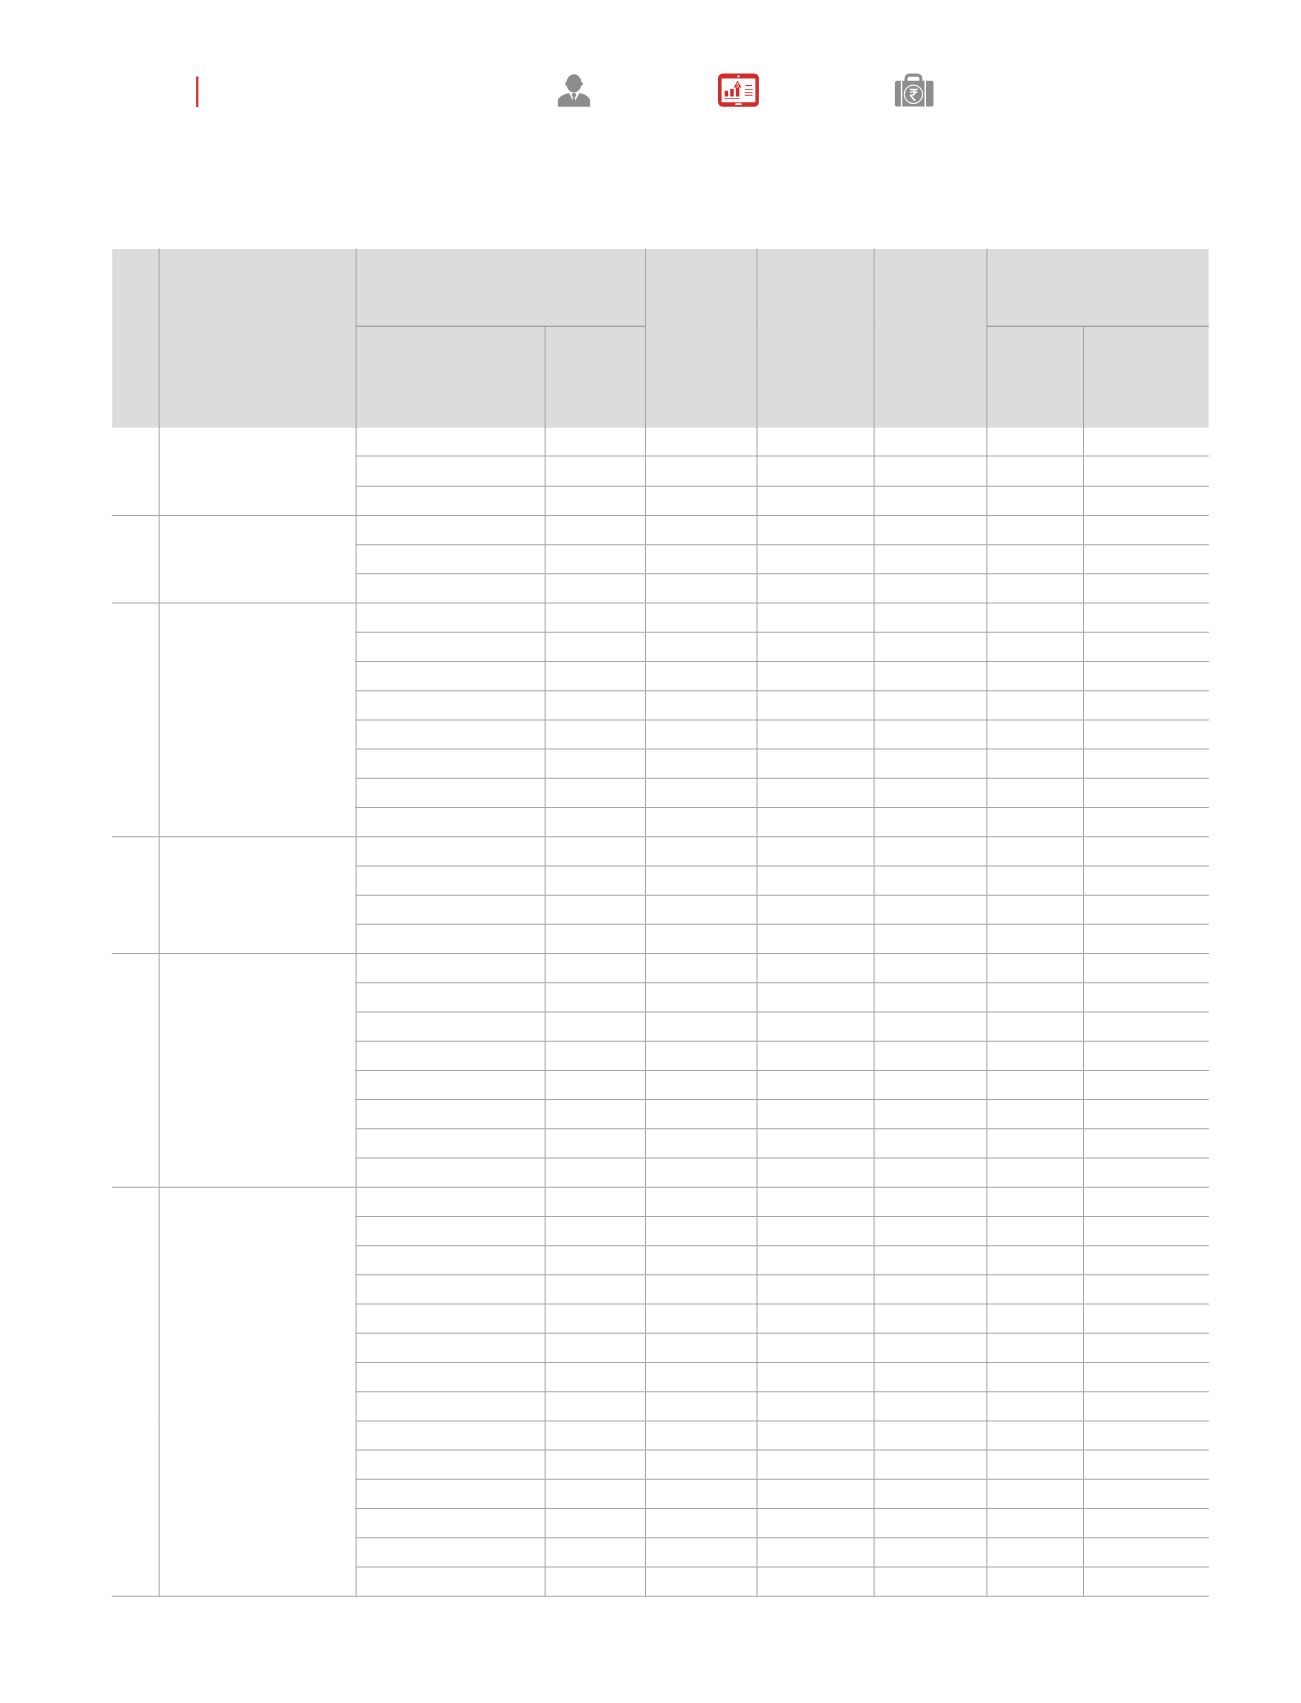
(d) Shareholding Pattern of top ten Shareholders:
(Other than Directors, Promoters and Holders of GDRs and ADRs):
Sl.
No.
Name & Category
Shareholding
Date
Increase/
decrease in
shareholding
Reason
Cumulative shareholding
during the year (1st April
2016 to 31st March 2017)
No. of shares at the
beginning (1st April
2016)/end of the year
(31st March 2017)
% of total
shares
of the
Company
No. of
shares
% of total
Shares of the
Company
1.
WESTBRIDGE
CROSSOVER FUND LLC
(IN30014210724452)
5885420
7.41
01-04-2016
04-10-2016 5885420 Sub- Division 11770840
7.41
11770840
7.41
31-03-2017
2.
GOVERNMENT
PENSION FUND GLOBAL
(IN30005410076881)
2450036
3.08
01-04-2016
04-10-2016 2450036 Sub- Division 4900072
3.08
4900072
3.08
31-03-2017
3.
JWALAMUKHI
INVESTMENT HOLD
(IN30014210713562)
4848823
6.10
01-04-2016
06-05-2016
-7900
Sale
4725423
5.97
13-05-2016 -390018
Sale
4335405
5.73
04-10-2016 4335405 Sub-Division 8670810
5.46
03-03-2017 -2426896
Sale
6243914
3.93
17-03-2017 -206268
Sale
6037646
3.80
24-03-2017 -283241
Sale
5754405
3.62
4356946
2.74
31-03-2017 -1397459
Sale
4356946
2.74
4.
GOLDMAN SACHS
INDIA LIMITED
(IN30016710044058)
1133257
1.42
01-04-2016
15-07-2016 -173648
Sale
959609
1.2
04-10-2016 959609 Sub- Division 1919218
1.21
2043060
1.29
31-03-2017 123842
Purchase
2043060
1.29
5.
STEADVIEW CAPITAL
MAURITIUS LIMITED
(IN30317320012164)
1549412
1.94
01-04-2016
10-06-2016
17310
Purchase
1566722
0.99
15-07-2016
99269
Purchase
1665991
2.09
04-10-2016 1665991 Sub- Division 3331982
2.1
17-02-2017 -75000
Sale
3256982
2.05
24-02-2017 -1000641
Sale
2256341
1.42
03-03-2017 -312021
Sale
1944320
1.22
1944320
1.22
31-03-2017
6.
J.P MORGAN FUNDS
(IN3034810006522)
276135
0.34
01-04-2016
06-05-2016 -43730
Sale
232405
0.29
13-05-2016 -39540
Sale
192865
0.24
05-08-2016
5540
Purchase
198405
0.24
26-08-2016
3030
Purchase
201435
0.25
02-09-2016
10600
Purchase
212035
0.26
04-10-2016 218575 Sub- Division 430610
0.27
04-11-2016
71500
Purchase
502110
0.32
11-11-2016
50040
Purchase
552150
0.35
18-11-2016
69063
Purchase
621213
0.39
25-11-2016
71927
Purchase
693140
0.44
31-12-2016
75570
Purchase
768710
0.48
06-01-2017
36100
Purchase
804810
0.51
03-03-2017
71870
Purchase
876680
0.55
057
ANNUAL
REPORT
20
16-17
KAJARIA
CERAMICS
CORPORATE
OVERVIEW
MANAGEMENT
REPORTS
FINANCIAL
STATEMENTS